The Missouri General Assembly has adjourned without taking any action to end Jefferson City’s obscene lobbyist gift culture.
Again.
- This year, like every year, there was talk about a lobbyist gift ban.
- In 2017, there was talk about a lobbyist gift ban.
- In 2016, there was talk about a lobbyist gift ban.
- In 2015, there was talk about a lobbyist gift ban.
- In 2014, there was talk about a lobbyist gift ban.
- In 2013, there was talk about a lobbyist gift ban.
- In 2012, there was talk about a lobbyist gift ban.
- In 2011, there was talk about a lobbyist gift ban.
- In 2010, there was talk about a lobbyist gift ban.
Missourians are done waiting for politicians and lobbyists in Jefferson City to clean up their act.
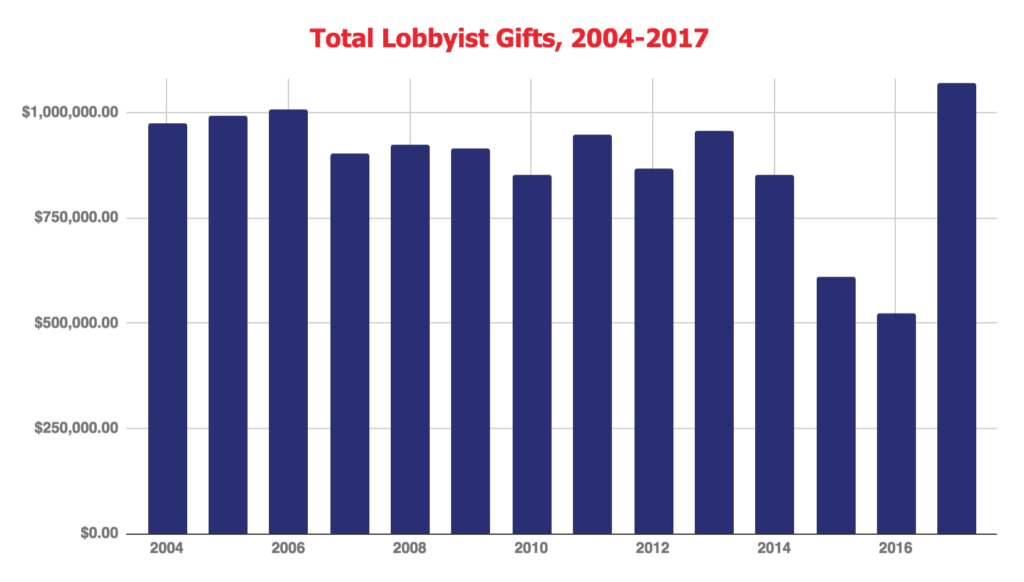
Since 2004, lobbyists have given an average of $885,020 worth of free meals, drinks, tickets and other gifts to members of the General Assembly, their staff members, and their family members. Just last year, lobbyists reported a whopping $1,070,653 in gifts to the General Assembly.
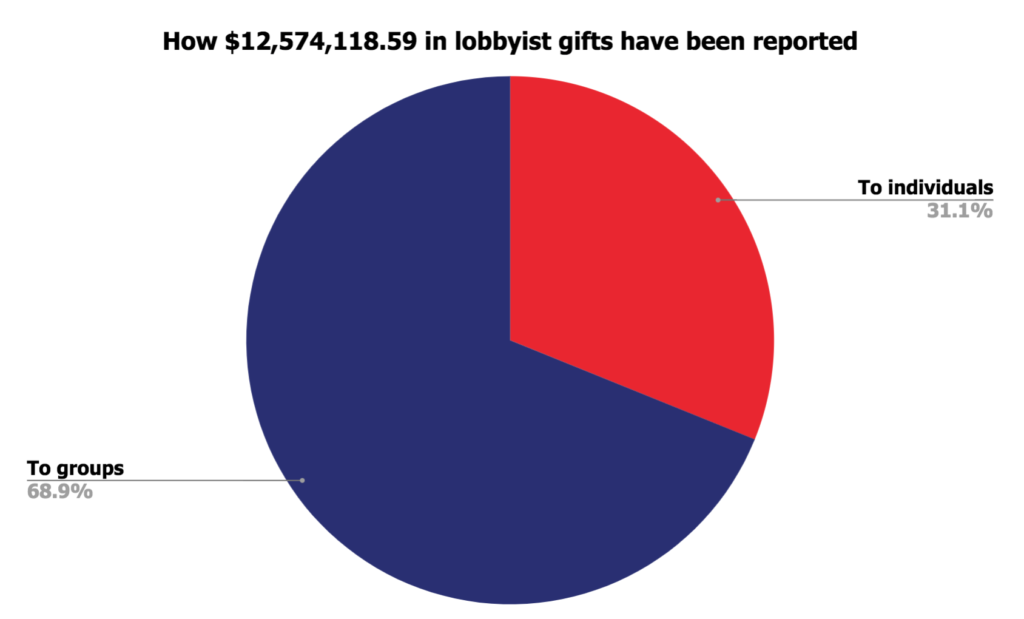
To make matters worse, 68% of the gifts reported to the Missouri Ethics Commission since 2004 have been listed as going to legislative groups, meaning Missourians have no idea who actually accepted $8,660,463 worth of gifts in the past 15 years.
The Clean Missouri initiative will eliminate almost all lobbyist gifts in the General Assembly by banning any single gift worth more than $5.
With its broad coalition of support from across the state, the Clean Missouri coalition submitted 346,956 signatures to the Secretary of State’s office on May 3, more than enough to qualify the initiative petition for the November 2018 ballot.
A growing number of Republicans, Democrats, and independents have publicly endorsed the full package of desperately-needed reforms in the Clean Missouri initiative to increase integrity, transparency and accountability in the Missouri General Assembly.
Signatures will now be counted and verified by local election authorities, and then the Clean Missouri amendment will be certified for the November 6, 2018 ballot.
| Year | House | Senate | Group | Total |
|---|---|---|---|---|
| 2004 | $124,169.18 | $27,621.73 | $822,777.41 | $974,568.32 |
| 2005 | $121,438.86 | $46,188.79 | $823,886.63 | $991,514.28 |
| 2006 | $130,518.74 | $51,622.09 | $823,909.48 | $1,006,050.31 |
| 2007 | $238,936.73 | $82,006.16 | $581,903.88 | $902,846.77 |
| 2008 | $214,720.10 | $86,581.75 | $621,931.94 | $923,233.79 |
| 2009 | $265,010.19 | $114,100.03 | $536,343.41 | $915,453.63 |
| 2010 | $243,514.30 | $100,886.58 | $508,716.20 | $853,117.08 |
| 2011 | $232,563.80 | $117,482.22 | $597,990.53 | $948,036.55 |
| 2012 | $223,114.15 | $104,293.33 | $540,691.04 | $868,098.52 |
| 2013 | $229,757.82 | $113,090.48 | $612,147.69 | $954,995.99 |
| 2014 | $188,888.63 | $73,856.28 | $587,820.60 | $850,565.51 |
| 2015 | $204,723.28 | $76,725.73 | $327,747.87 | $609,196.88 |
| 2016 | $175,194.18 | $62,508.87 | $284,252.01 | $521,955.06 |
| 2017 | $140,625.92 | $63,347.24 | $866,680.06 | $1,070,653.22 |
| 2018 (Jan-Mar) | $39,950.93 | $20,217.17 | $123,664.58 | $183,832.68 |
| Grand Total | $2,773,126.81 | $1,140,528.45 | $8,660,463.33 | $12,574,118.59 |
| Average | $195,226.85 | $80,022.23 | $609,771.34 | $885,020.42 |